
Picture this: you’re staring at a price chart, trying to figure out which direction the market will move next. You scroll through news headlines. You check a few indicators. And then — you guess.
Most new traders live in that guessing zone far too long.
But here’s what changes everything: candlestick patterns. These aren’t magic signals. They’re the visual language of the market — a way of reading what buyers and sellers are actually doing at any given moment.
Every single candle on your chart tells a story. A group of candles tells a bigger story. Once you learn to read them, you stop guessing and start interpreting.
In this guide, you’ll learn:
- What candlestick patterns are and why they still work
- How to read them correctly (not just memorize shapes)
- The most reliable bullish and bearish patterns
- How to use them in a real trading workflow
Let’s get into it.
Understanding the Basics Before Patterns
Anatomy of a Candlestick
Before you learn patterns, you need to understand a single candle. Every candlestick on your chart has four key components:
- Body — the thick rectangular part. It represents the range between the opening and closing price.
- Upper Wick (Shadow) — the thin line above the body. It shows the highest price reached during that period.
- Lower Wick (Shadow) — the thin line below the body. It shows the lowest price reached.
Color — a green (bullish) candle means price closed higher than it opened. A red (bearish) candle means price closed lower.
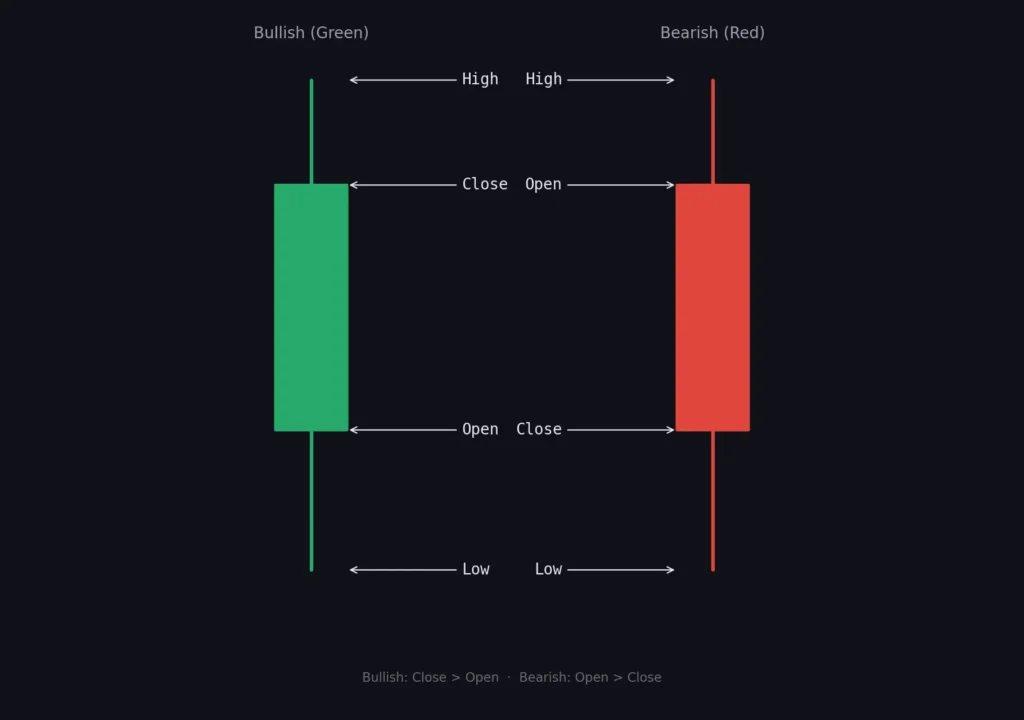
What This Image Shows: This image shows a single candlestick with clearly labeled parts. The green/bullish candle is on the left side, the red/bearish candle on the right. Arrows point to: the Upper Wick (labeled “High”), the Body top (labeled “Close” on the green candle, “Open” on the red), the Body bottom (labeled “Open” on the green, “Close” on the red), and the Lower Wick (labeled “Low”). The background is dark (TradingView style). Text labels are clean and white.
What a Single Candle Tells You
A candle with a big green body and tiny wicks tells you buyers were in total control — price opened, moved up strongly, and closed near the high. Powerful bullish momentum.
A candle with a long upper wick and small body tells a different story — buyers tried to push price up, but sellers rejected the move hard. The wick is evidence of a failed breakout.
This is the core idea: every candle is a battle between buyers and sellers, and the result is visible in its shape.
How Candlestick Patterns Are Formed
Candlestick patterns work because human psychology is repetitive.
When price reaches a level where it reversed before, traders react the same way — again and again. Fear, greed, panic, and hope create the same formations across forex, stocks, and crypto.
This is why a hammer pattern on a daily Bitcoin chart looks identical to a hammer on a 4-hour EUR/USD chart. The market structure is different, but the human behavior behind it is the same.
Patterns aren’t random. They’re the footprints of crowd psychology — and once you recognize them, you can anticipate what’s likely to happen next.
Classification of Candlestick Patterns
Not all patterns carry the same weight. The more candles involved in a pattern, the more confirmation it carries.
Single-Candle Patterns
These form in one candle. They’re quick signals and often early warnings, but they need context to be reliable. A hammer on its own doesn’t mean much — a hammer at a strong support level is a different story.
Double-Candle Patterns
These require two candles to form and are generally stronger than single-candle signals. The second candle confirms what the first one suggested. Examples: Engulfing patterns, Tweezer Tops and Bottoms.
Triple-Candle Patterns
Three candles, more time, more confirmation. These patterns are slower to form but signal stronger market intent. Examples: Morning Star, Evening Star, Three White Soldiers.
Major Candlestick Patterns You Must Know
Bullish Reversal Patterns
These form at the bottom of a downtrend and signal that buyers are taking over.
🔨 Hammer
What it looks like: Small body at the top, long lower wick (at least 2x the body length), little to no upper wick.
What it means: Price was pushed down sharply during the session, but buyers stepped in and pushed it back up to close near the open. A strong sign of buyer defense.Where it appears: At the bottom of a downtrend, ideally at a support level.
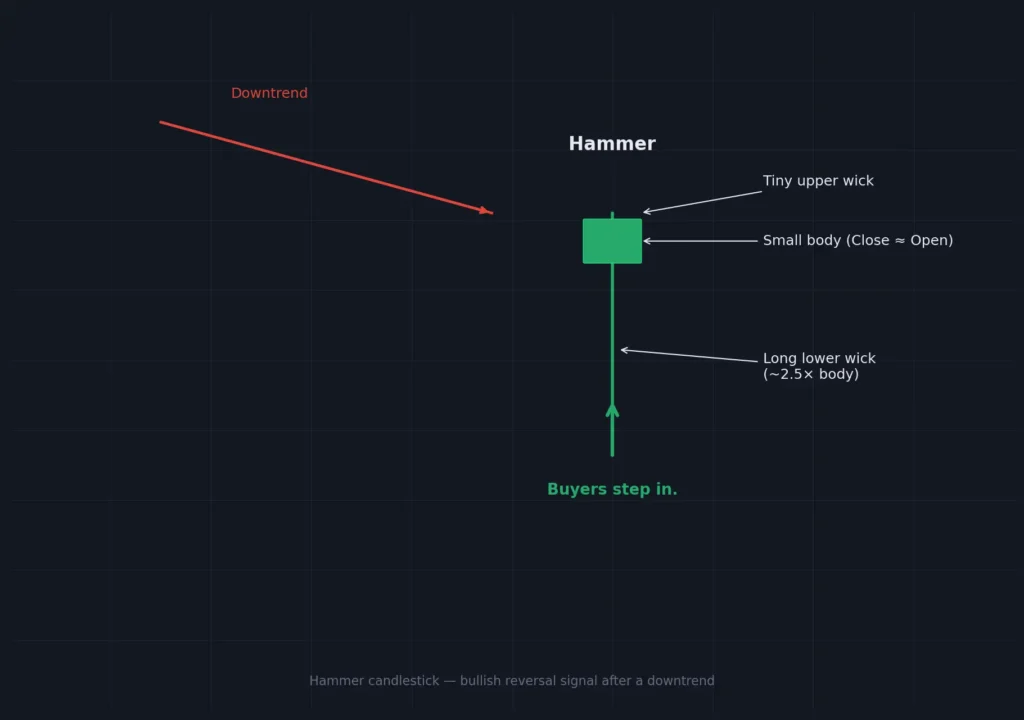
What This Image Shows: A single green hammer candle on a dark chart background. The body is small and sits at the top of the candle. The lower wick is approximately 2.5 times the body length. A small arrow below the candle points upward, labeled “Potential reversal.” A red downward trend line is drawn to the left, showing the prior downtrend. Clean, minimal, educational style.
📈 Bullish Engulfing
What it looks like: A small red candle followed by a larger green candle that completely “engulfs” the red body.
What it means: Sellers had control, but buyers came in with such force they overtook the entire previous candle. Strong reversal signal.
Where it appears: At the end of a downtrend, best at key support or demand zones.
🌅 Morning Star
What it looks like: Three candles — a large red candle, a small indecision candle (or doji), then a large green candle.
What it means: The market paused after a drop (the small middle candle), then buyers took control decisively. It shows a clean shift from seller to buyer dominance.Where it appears: Strong reversal signal at major support zones.
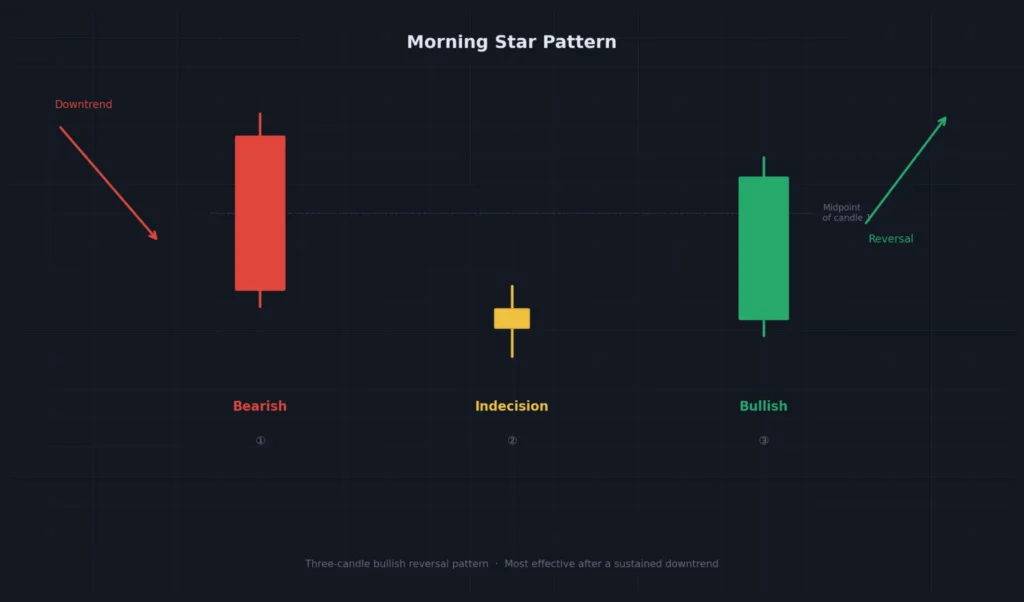
What This Image Shows: Three candlesticks in sequence on a dark background. First candle is large and red (bearish). Second candle is small with a tiny body (can be a doji or spinning top) — this is the “indecision” candle. Third candle is large and green, closing above the midpoint of the first candle. Below the group, text reads “Morning Star.” Arrows show the sequence: down → pause → up. Clean, educational, professional chart style.
Bearish Reversal Patterns
These form at the top of an uptrend and signal that sellers are taking control.
💫 Shooting Star
What it looks like: Small body at the bottom, long upper wick, little to no lower wick. Looks like an upside-down hammer.
What it means: Buyers pushed the price up hard during the session, but sellers rejected the move and pushed it back down. A sign that the uptrend may be losing steam.
Where it appears: At the top of an uptrend, ideally at a resistance level.
📉 Bearish Engulfing
What it looks like: A small green candle followed by a larger red candle that completely swallows the green body.
What it means: Buyers had control, but sellers came in aggressively and overwhelmed them entirely. High-probability reversal signal.
Where it appears: At the end of an uptrend, best at key resistance or supply zones.
🌆 Evening Star
What it looks like: The mirror of the Morning Star — large green candle, small indecision candle, then a large red candle.
What it means: Buyers were in control, market paused, then sellers took over completely. One of the most reliable bearish reversal signals.Where it appears: At the top of a strong uptrend or at major resistance zones.
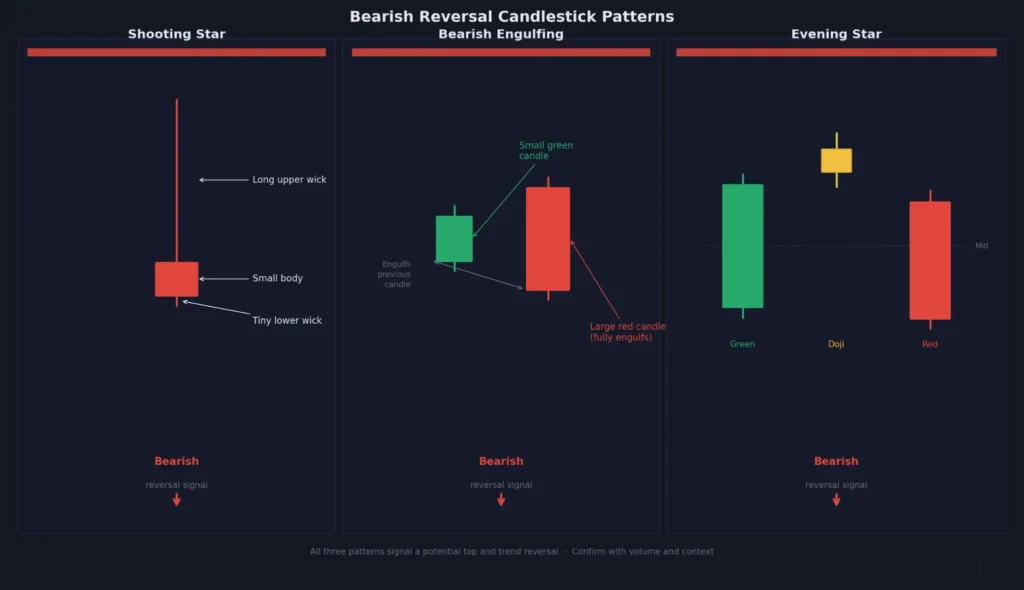
What This Image Shows: A side-by-side comparison of three bearish candlestick patterns on a dark chart background. Left: Shooting Star — small red body at bottom, long upper wick, labeled “Shooting Star.” Center: Bearish Engulfing — a small green candle followed by a large red candle covering it fully, labeled “Bearish Engulfing.” Right: Evening Star — three candles (green, small, red), labeled “Evening Star.” Each pattern has a small red downward arrow below it. White labels, clean minimal educational design.
Continuation Patterns
These don’t signal a reversal — they signal that the current trend is pausing before continuing.
Doji — Open and close are almost identical, creating a cross shape. Alone, it signals indecision. In the context of a strong trend, it often signals a brief pause before continuation.
Spinning Top — Small body with wicks on both sides. Shows balance between buyers and sellers. Often appears as a temporary pause in a trend.
Rising/Falling Three Methods — A strong trend candle, followed by 2–3 small candles moving against the trend, then another strong candle in the original direction. The market is catching its breath, not reversing.
How to Read Candlestick Patterns in Real Trading
Context is Everything
Here’s the truth most beginner guides skip: a candlestick pattern without context is nearly worthless.
A hammer at a random point in a chart means nothing. A hammer after a sustained downtrend, sitting right on a major support level, with volume spiking — that’s a different signal entirely.
Always combine patterns with:
- Trend direction — are you trading with or against the trend?
- Key price levels — is the pattern forming at support, resistance, or a psychological level?
Entry Timing Using Patterns
Never enter the moment a pattern appears. Wait for confirmation — the next candle.
For a bullish signal, you want to see the following candle open and hold above the pattern. For a bearish signal, wait for confirmation of the drop. Entering early is one of the most common and costly mistakes in trading.
Stop-Loss Placement
Every pattern gives you a natural stop-loss level:
- Bullish patterns → stop goes just below the pattern’s lowest point (the low of the hammer, the low of the morning star)
- Bearish patterns → stop goes just above the pattern’s highest point (the high of the shooting star, the high of the evening star)
This keeps your risk logical and tied to the pattern itself.
Reliability: Which Candlestick Patterns Actually Work?
Not all patterns are created equal. Here’s what increases the reliability of any pattern:
- Higher timeframes — a pattern on the daily or weekly chart carries far more weight than one on a 5-minute chart
- Strong trend context — a reversal pattern is most powerful at the end of an extended, clear trend
- Volume confirmation — if volume spikes when the pattern forms, it validates the move
- Key level alignment — a pattern forming exactly at support, resistance, or a round number is significantly stronger
The most reliable candlestick patterns are typically the ones with two or three candles, forming on higher timeframes, at obvious price levels, with volume support.
Common Mistakes Beginners Make
Avoid these traps — they’re responsible for a lot of unnecessary losses:
- ❌ Memorizing shapes without understanding — knowing what a pattern looks like without understanding why it forms means you’ll misread context every time
- ❌ Trading every pattern you see — most patterns don’t meet the full criteria. Be selective.
- ❌ Ignoring market structure — a bullish pattern in a strong downtrend is fighting the trend. The trend usually wins.
- ❌ Using too many indicators — adding five indicators to confirm a pattern often creates confusion, not clarity. Keep it clean.
Practical Workflow: How to Use Patterns Step by Step
This is where everything comes together. Here’s a simple, repeatable process:
Step 1 — Identify the trend What’s the dominant direction on the higher timeframe? Use a 50 or 200 EMA to see this clearly. You want to know if you’re in a downtrend, uptrend, or range.
Step 2 — Mark key levels Draw your major support and resistance zones. These are the areas where patterns carry the most weight.
Step 3 — Wait for a pattern Don’t force it. Let the pattern come to you. A clear hammer at support is worth waiting for.
Step 4 — Confirm entry Wait for the next candle to close. If it confirms the pattern’s direction, that’s your entry signal.Step 5 — Manage risk Place your stop-loss just beyond the pattern’s structure. Set a realistic take-profit target at the next key level. Risk only what you’re comfortable losing.
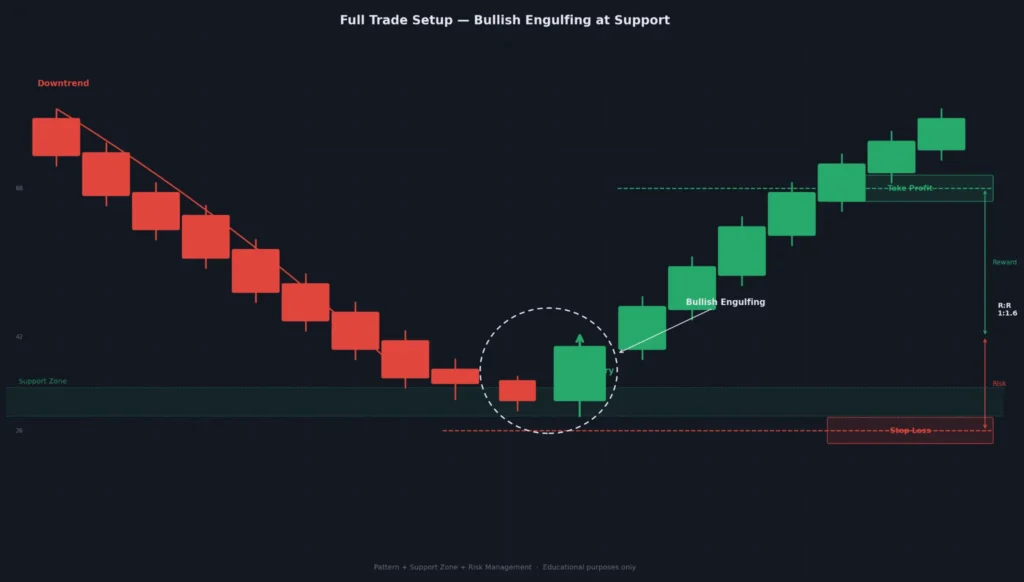
What This Image Shows: A real-looking candlestick chart (dark background, TradingView style) showing a complete trade setup. A clear downtrend is visible on the left. Price hits a marked green support zone. A bullish engulfing pattern forms at the support level (highlighted with a circle or box). An entry arrow points upward from the pattern. A red horizontal line below marks the stop-loss. A green horizontal line above marks the take-profit target. Text labels: “Support Zone,” “Bullish Engulfing,” “Stop Loss,” “Take Profit.” Clean, professional, educational.
Visual Learning Tip
Reading about candlestick patterns is one thing. Seeing them in real charts is another.
The best way to get good fast:
- Use a chart replay tool — TradingView has a built-in bar replay feature. Go back in time and practice identifying patterns in real historical data without knowing the outcome first.
- Backtest your setups — go through at least 50–100 historical examples of a pattern before trading it live. Look at what happened after.
- Keep a trade journal — screenshot every pattern you trade (win or lose). Review them weekly. You’ll start seeing your own strengths and blind spots.
Conclusion
Candlestick patterns are powerful — but they’re tools, not magic.
No pattern has a 100% win rate. No pattern works in isolation. What makes them valuable is combining them with trend awareness, key price levels, and disciplined risk management.
The traders who benefit most from candlestick patterns aren’t the ones who memorized the most patterns. They’re the ones who deeply understood a few patterns and applied them consistently in the right context.
Start with the hammer, the engulfing patterns, and the morning/evening star. Learn those well. Practice on historical charts. Build your confidence before going live.
Your next step: combine these patterns with support and resistance levels and trend analysis — and you’ll have the foundation of a complete, rule-based trading approach.
Quick Reference: Summary of Key Patterns
| Pattern | Type | Candles | Signal |
| Hammer | Bullish Reversal | 1 | Buyers reject lower prices |
| Shooting Star | Bearish Reversal | 1 | Sellers reject higher prices |
| Bullish Engulfing | Bullish Reversal | 2 | Strong buyer takeover |
| Bearish Engulfing | Bearish Reversal | 2 | Strong seller takeover |
| Morning Star | Bullish Reversal | 3 | Downtrend exhaustion |
| Evening Star | Bearish Reversal | 3 | Uptrend exhaustion |
| Doji | Continuation/Neutral | 1 | Market indecision |
| Spinning Top | Continuation/Neutral | 1 | Brief trend pause |