Here’s a hard truth — the majority of traders lose money not because they lack intelligence, but because they lack structure. They enter trades randomly, exit out of emotion, and have no clear plan for managing risk.
That’s where support and resistance comes in.
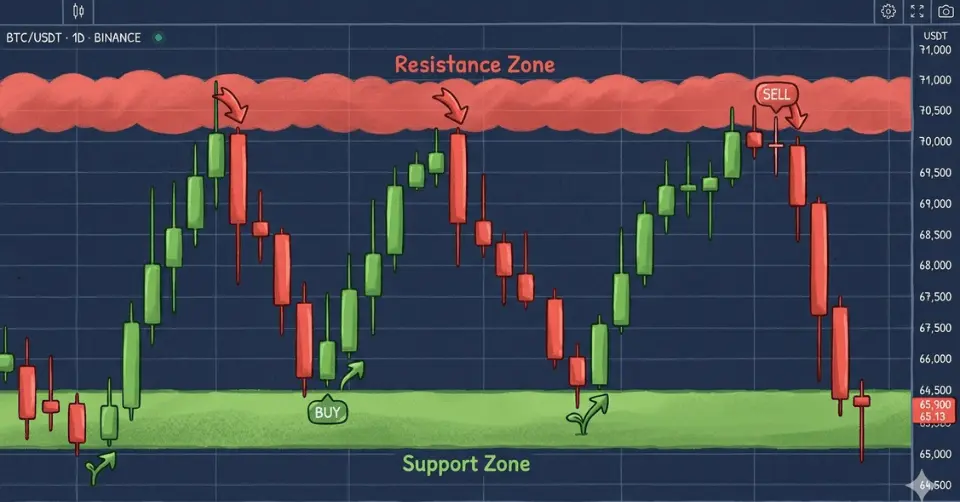
Support and resistance is one of the most fundamental concepts in trading. Whether you’re trading forex, stocks, or crypto — these levels act as a roadmap on your chart. They show you where price has reacted before and where it’s likely to react again.
Master this concept, and you’ll have a clear edge in:
- Timing your entries more precisely
- Planning your exits before you even place a trade
- Managing risk with logical stop-loss placement
In this guide, you’ll learn exactly what support and resistance is, the different types, how to identify them correctly, and how to build a simple trading strategy around them.
What is Support and Resistance?
What is Support?
Support is a price floor — a level where price has fallen to, but struggled to break below. Think of it like the ground. When price drops to a support zone, buyers start stepping in. They see value, they buy, and price bounces back up.
Why does this happen? Because at that level, demand is stronger than supply.
What is Resistance?
Resistance is the opposite — a price ceiling. It’s a level where price has risen to, but failed to break above. Sellers become active at resistance because they believe the price is too high and start selling, pushing it back down.
Why does this happen? Because at that level, supply is stronger than demand.
The Psychology Behind It
Markets are driven by human emotion — fear and greed. When price reaches a level where it reversed before, traders remember it. Buyers who missed the previous move wait to buy again. Sellers who got burned wait to sell again.
This is called market memory, and it’s the core reason support and resistance levels actually work.
Why Support and Resistance Matters in Trading
This isn’t just theory. These levels directly impact how you trade every single day.
Here’s what they help you do practically:
- Find entry points — buy near support, sell near resistance
- Set exit targets — take profit before a major resistance zone
- Place stop-losses logically — just below support or above resistance
And the best part? These levels work across every market:
- 📈 Forex (e.g., EUR/USD bouncing off 1.0800)
- 📊 Stocks (e.g., Apple finding support at $170)
- 🪙 Crypto (e.g., Bitcoin holding the $60,000 zone)
Types of Support and Resistance
Horizontal Support and Resistance
This is the most common type. You draw a flat horizontal line across previous swing highs or lows. If price touched a level multiple times in the past, it’s a key support and resistance zone to watch.
Dynamic Support and Resistance
These levels move with price. The most common tools for dynamic support and resistance are moving averages — like the 50 EMA or 200 EMA. Price often bounces off these during trending markets.
Trendline Support and Resistance
When price is trending, you can draw diagonal trendlines connecting the highs (resistance) or lows (support). These are especially useful in forex support and resistance trading during strong trends.
Psychological Levels
Round numbers carry emotional weight. Levels like 1.2000, $100, or $1,000 attract massive attention from retail and institutional traders alike. Price often hesitates or reverses around these psychological levels in trading — simply because traders place orders there.
How to Identify Support and Resistance Levels
Using Price Action
Look for swing highs and swing lows — points where price clearly reversed. The more times a level has been tested, the stronger it is. Multiple touches = more significance.
Using Indicators
Two popular tools:
- Moving averages — act as dynamic support or resistance
- Pivot points — auto-calculated levels used by institutional traders
Use Zones, Not Exact Lines
One of the biggest mistakes beginners make is treating support and resistance like a precise number. In reality, price doesn’t reverse at an exact pip or cent — it reacts within a zone.
Draw a small zone around your level instead of a single line. This gives you a more realistic view of where price might react.
How to Use Support and Resistance in Trading
Buying at Support (Bounce Strategy)
When price approaches a known support zone, wait for a bullish candlestick signal (like a pin bar or engulfing candle) before entering long. Don’t just buy blindly — wait for confirmation.
Selling at Resistance (Rejection Strategy)
Same idea in reverse. When price hits resistance and shows a bearish rejection candle, that’s your signal to consider a short trade or exit a long position.
Breakout Trading
Sometimes price doesn’t bounce — it breaks through. A breakout above resistance is bullish. A breakdown below support is bearish.
Tip: Don’t chase breakouts. Wait for a close above/below the level, not just a wick through it.
The Retest Strategy
This is one of the most reliable setups:
- Price breaks a key level
- It pulls back to retest that level (old resistance becomes new support)
- You enter after confirmation
This strategy works beautifully in stock market support and resistance and forex trading alike.
Common Mistakes Traders Make
Avoid these if you want to trade these levels consistently:
- ❌ Drawing too many lines — cluttered charts lead to confused decisions
- ❌ Ignoring the trend — don’t buy support in a strong downtrend
- ❌ Treating levels as exact prices — use zones instead
- ❌ Entering without confirmation — always wait for a signal candle
Pro Tips for Better Accuracy
Want stronger, more reliable levels? Combine support and resistance with:
- Trend analysis — trade in the direction of the higher timeframe trend
- Volume — high volume at a level confirms its importance
- Candlestick patterns — pin bars, engulfing candles, doji patterns
Also, always check higher timeframes first. A support zone on the daily chart is far more powerful than one on the 5-minute chart.
Conclusion
Support and resistance is not a fancy indicator or a secret strategy. It’s a foundational skill every trader needs — whether you’re a complete beginner or refining your edge after years of trading.
Once you can confidently identify key levels and understand how price behaves around them, everything else — your entries, exits, and risk management — becomes much clearer.
Start simple. Mark a few clear zones on your chart. Watch how price reacts. Build from there.
Your next step? Learn how to combine these levels with trend analysis and candlestick patterns to create a complete, rule-based trading system.