

The market moves fast — and emotions move even faster.
One minute you’re confident in a trade. The next, price spikes against you and panic sets in. You exit early, miss the move, and watch the market go exactly where you expected.
Sound familiar? This is where trading indicators come in.
Indicators are tools built into every charting platform that help you:
- Read the trend — so you’re not trading against the market
- Measure momentum — so you know if a move has strength behind it
- Find better entries and exits — with data, not gut feeling
- Reduce emotional decisions — by giving you a framework to follow
But here’s something important to understand before we go deeper: indicators are tools, not prediction machines. They don’t tell you what the market will do. They help you understand what the market is doing right now — and that distinction matters.
In this guide, you’ll learn what trading indicators are, the different types, which ones actually work, and how to use them properly — without overcomplicating your charts.
What Are Trading Indicators?
Simple Definition
Trading indicators are mathematical calculations applied to a price chart. They’re built using combinations of:
- Price (open, high, low, close)
- Volume (how much was traded)
- Volatility (how fast price is moving)
The result is a visual overlay or panel on your chart — a line, histogram, band, or oscillator — that helps you interpret what’s happening in the market.
Why Indicators Exist
The human eye is good at spotting patterns — but it’s also great at seeing patterns that aren’t really there. Indicators remove that bias by applying consistent, rules-based calculations to raw price data.
They help you:
- Spot trends earlier
- Confirm what price action is already suggesting
- Identify when a market is overextended
Are Indicators Necessary?
Honestly? Not always.
Some professional traders rely entirely on price action — reading raw candles, support and resistance levels, and market structure with zero indicators. And they do very well.
Others combine indicators with price action for added confirmation. Neither approach is wrong. What matters is consistency and understanding why you’re using a tool — not just that everyone else is using it.
The Main Categories of Trading Indicators
Before jumping into specific indicators, it helps to understand the four main categories. Each one serves a different purpose.
Trend Indicators
Purpose: Tell you the direction the market is moving.
Examples: Moving Average, MACD, Supertrend
Trend indicators are your best friend in a trending market. If price is consistently moving in one direction, these tools keep you aligned with that move.
The downside? They struggle in sideways (ranging) markets. When price is chopping left and right, trend indicators generate a lot of false signals.
Momentum Indicators
Purpose: Measure the speed and strength of a price move.
Examples: RSI (Relative Strength Index), Stochastic Oscillator
Momentum indicators help you answer the question: Is this trend still strong, or is it running out of steam?
They’re particularly useful for identifying overbought and oversold conditions — situations where price has moved too far, too fast, and a pullback or reversal may be coming.
Volume Indicators
Purpose: Analyze how much buying or selling activity is behind a price move.
Examples: On-Balance Volume (OBV), Volume Profile
Volume is the market’s lie detector. A price breakout with high volume is genuine. A breakout with low volume is suspicious.
Volume indicators confirm whether a price move has real participation behind it — or whether it’s likely to fade.
Volatility Indicators
Purpose: Measure how fast and how far price is moving.
Examples: Bollinger Bands, ATR (Average True Range)
When volatility is low, markets tend to be quiet and consolidating. When volatility expands, big moves are happening — or about to happen. Volatility indicators are especially useful during breakout conditions, helping you gauge whether a move has energy behind it.
Leading vs Lagging Indicators
This is one of the most important concepts in technical analysis indicators — and most beginners skip right past it.
Leading Indicators
Leading indicators try to predict price movement before it happens. They react quickly and give early signals — but that speed comes at a cost: more false signals.
Examples: RSI, Stochastic Oscillator
These are useful for timing entries early, but they require extra confirmation before acting on them blindly.
Lagging Indicators
Lagging indicators confirm what’s already happening. They’re slower to signal, but much more reliable when they do.
Examples: Moving Averages, MACD
By the time a lagging indicator signals a trend, you may miss the very beginning of the move — but you’re also far less likely to be caught in a false breakout.
Why Traders Combine Both
Smart traders use leading indicators to find potential entries and lagging indicators to confirm them. For example: RSI signals a potential reversal, but you only enter after the moving average confirms the direction has shifted.
That combination cuts down on false signals while keeping you responsive to the market.
Most Popular Trading Indicators Explained
Moving Average (MA)
The moving average smooths out price data to show the overall trend direction. Instead of watching every candle spike up and down, the MA gives you a clean line representing the average price over a set period (e.g., 50 days or 200 days).
How traders use it:
- Price above the MA = bullish bias
- Price below the MA = bearish bias
- MA itself acts as dynamic support or resistance
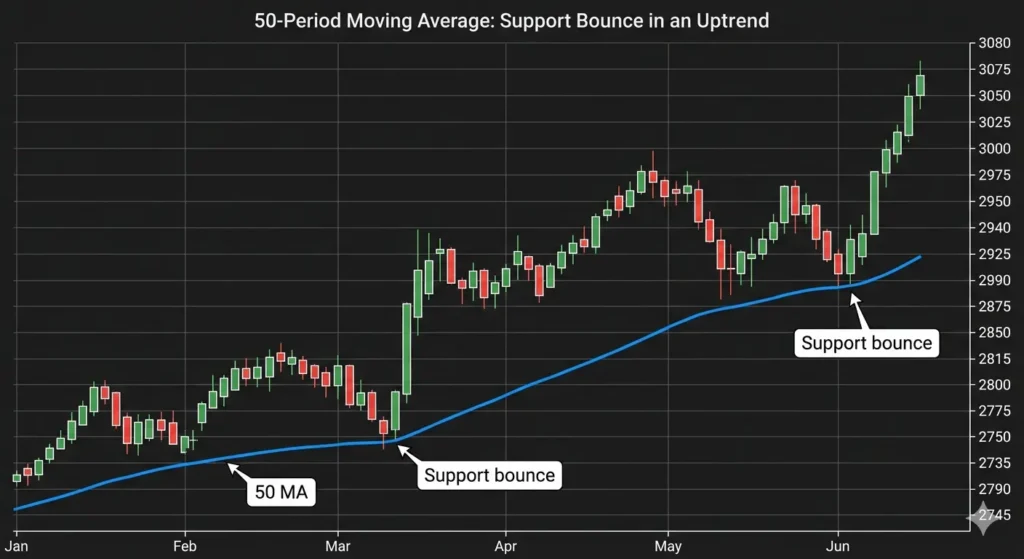
What This Image Shows: A dark-background price chart showing a rising candlestick chart with a smooth blue curved line (the 50 MA) running below the price. Price touches the MA line twice and bounces upward. Labels: “50 MA” on the line, “Price bounces off MA” at the touch points. Clean, educational, TradingView-style.
RSI (Relative Strength Index)
The RSI is a momentum indicator that moves between 0 and 100. It measures how fast and how strongly price is moving.
Key levels:
- Above 70 = overbought (price may be due for a pullback)
- Below 30 = oversold (price may be due for a bounce)
- RSI Divergence = when price makes a new high but RSI doesn’t — a warning sign
The RSI is one of the most accurate trading indicators for identifying momentum shifts before a reversal.
MACD (Moving Average Convergence Divergence)
The MACD combines trend and momentum into one indicator — which is why it’s so widely used.
It consists of:
- MACD Line — faster moving average minus slower moving average
- Signal Line — a smoothed version of the MACD line
- Histogram — the difference between the two
How traders use it:
- MACD line crosses above the signal line = bullish signal
- MACD line crosses below the signal line = bearish signal
- Histogram growing = momentum increasing
Bollinger Bands
Bollinger Bands consist of three lines: a middle moving average, an upper band, and a lower band. The bands expand when volatility is high and contract when volatility is low.
How traders use them:
- Price touching the upper band = potentially overbought
- Price touching the lower band = potentially oversold
- Bollinger Squeeze = bands contract tightly, signaling a big move is coming
Fibonacci Retracement
Not a traditional indicator, but one of the most widely used tools in indicator trading strategy.
After a strong price move, markets often retrace (pull back) to specific Fibonacci levels — 38.2%, 50%, and 61.8% — before continuing in the original direction. These levels act as potential entry zones for traders looking to join an existing trend.
How Traders Actually Use Indicators
Theory is one thing. Here’s how indicators are applied in real trading decisions.
Trend Confirmation
Before entering any trade, check the trend on a higher timeframe.
- Price consistently above the 50 or 200 MA → bullish bias, look for long setups
- Price below → bearish bias, look for shorts or stay out
This single filter eliminates a huge percentage of bad trades.
Finding Trade Entries
- RSI pullback entry — wait for RSI to dip to 40–50 in an uptrend, then bounce back. That’s your entry signal into a healthy trend.
- MACD crossover entry — when the MACD line crosses above the signal line near a key support level, it’s a strong buy signal.
Exit and Risk Management
- ATR for stop-loss sizing — if the ATR is 50 pips, your stop-loss should be at least that far away so normal volatility doesn’t knock you out
- Moving average trailing exit — trail your stop-loss just below the MA as price moves in your favor, locking in profit while riding the trend
Combining Indicators the Right Way
More indicators ≠ better trading. In fact, the opposite is often true.
Smart combinations:
- Trend + Momentum → Moving Average + RSI (confirm direction AND strength)
- Volume + Breakout → OBV + price level break (confirm the breakout is real)
- Volatility + Trend → Bollinger Bands + MA (find squeeze setups in trending conditions)
The indicator stacking problem:
Many beginners load five indicators onto their chart — MACD, RSI, Stochastic, two moving averages, and Bollinger Bands. The problem? They’re all measuring roughly the same thing: momentum. They’ll all signal at the same time and feel like strong confirmation — but it’s just repetition, not actual confirmation.
Rule of thumb: Use one indicator from different categories. One trend tool, one momentum tool. That’s often all you need.
Common Mistakes Traders Make with Indicators
Avoid these habits — they cost real money:
❌ Depending entirely on indicators — indicators follow price; price doesn’t follow indicators. Market structure and context always come first.
❌ Ignoring market structure — an RSI oversold signal in a strong downtrend is not a buy signal. Know what kind of market you’re in.
❌ Using too many indicators — cluttered charts lead to paralysis and contradicting signals.
❌ Constantly changing settings — tweaking the RSI from 14 to 9 to 21 every week means you’re curve-fitting, not trading.
❌ Blindly copying strategies online — someone’s indicator setup that “works” in their videos may be backtested on cherry-picked data. Always test yourself.
Best Indicators for Different Trading Styles
The best trading indicators depend heavily on how you trade — not just what you trade.
Scalping (1–5 minute charts)
Fast signals, low lag. Every second counts.
- EMA (Exponential Moving Average) for quick trend reads
- RSI for momentum confirmation on fast timeframes
Day Trading (15-minute to 1-hour charts)
Need reliable intraday signals.
- VWAP (Volume Weighted Average Price) — the most important intraday level; price above VWAP = bullish session bias
- MACD for momentum and crossover entries
Swing Trading (4-hour to daily charts)
Looking to hold trades for days or weeks.
- Moving Averages (50 & 200) for trend direction and dynamic support
- Fibonacci Retracement for finding pullback entry zones in trending markets
Long-Term Investing (Weekly charts)
Position sizing and macro trend awareness.
- 200-day Moving Average — the most watched indicator by institutional investors
- Volume analysis — sustained accumulation on rising volume = healthy long-term trend
Do Indicators Work Alone?
Short answer: rarely.
The best indicator signal in the world is weakened if it appears in the wrong context. Before acting on any indicator signal, ask yourself:
- Where is price? Is it near a major support or resistance level?
- What’s the trend? Is this signal with or against the dominant direction?
- What does the candlestick say? Is there a reversal pattern confirming the signal?
- What’s happening in the news? A high-impact news event can override any technical setup in seconds.
This is how experienced traders think about technical analysis indicators — not as isolated signals, but as one layer of a complete picture.
This is also why indicators pair so naturally with what you’ve already learned about candlestick patterns and support and resistance. Each concept reinforces the other.
Final Thoughts: Indicators Are Tools, Not Shortcuts
After reading this guide, you understand more about trading indicators than the majority of retail traders who’ve been at this for years.
But understanding is only the beginning.
No indicator is 100% accurate. No setup wins every time. What separates consistently profitable traders from the rest isn’t the best indicator combination — it’s three things that no indicator can give you:
- Risk management — protecting your capital on every trade
- Discipline — following your rules even when emotions say otherwise
- Consistency — showing up and applying your process, day after day
Start simple. Pick one trend indicator and one momentum indicator. Learn them deeply. Watch how they behave across different market conditions. Test before you trade live.
The market rewards patience and preparation — not complexity.
Quick Reference: Indicator Cheat Sheet
| Indicator | Category | Best For |
| Moving Average | Trend | Trend direction, dynamic S&R |
| EMA | Trend | Faster trend signals (scalping) |
| MACD | Trend + Momentum | Crossover entries, histogram |
| RSI | Momentum | Overbought/oversold, divergence |
| Stochastic | Momentum | Short-term reversals |
| Bollinger Bands | Volatility | Breakout setups, squeeze |
| ATR | Volatility | Stop-loss sizing |
| OBV | Volume | Confirming breakouts |
| VWAP | Volume | Intraday trend bias |
| Fibonacci | Price Structure | Pullback entry zones |